We covered the “Liberation Day” tariff announcements extensively in April, so we’ll keep our commentary here to a minimum. In summary, our investment strategy is largely insulated from the direct effects of import tariffs because our service-oriented portfolio companies typically don’t manufacture anything or move goods across borders. Additionally, our private funds are much less susceptible to the wild price swings that engulf public markets during times of uncertainty.
In the months since the original announcement, most of the initial tariffs have been paused or negotiated lower. As a result, investors have regained confidence and risk assets have moved back toward all-time highs (Graph 1).
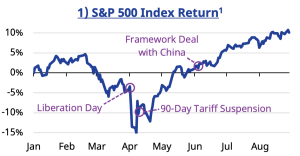
We welcome the calmer market backdrop but expect tariffs to remain a tactical tool for policymakers in the coming months and years, subject to judicial decisions on their legality. As always, we’ll keep our heads below the fray in the core middle market.
Financial markets have rebounded on the back of constructive economic data. For instance, real GDP increased at an annual rate of 3.3% in the second quarter(2) and the unemployment rate remains historically low at 4.2%.(3).
Corporate earnings have likewise been strong. The year-over-year earnings growth rate for the S&P 500 was 12% in the second quarter.(4) Our portfolio of 193 investments has also been resilient, with year-to-date earnings up 14% compared to the same period last year.(5)
Our position as an incumbent lender provides excellent visibility into the state of the economy, especially given that we receive monthly financial data for the vast majority of our investments. This intelligence enables us to expand in outperforming sectors, scale back under-performers, and identify emerging trends early.
As an example, we have proactively rotated our portfolio away from consumer goods over the past two years based on intelligence we garnered from portfolio company reporting. This decision now seems timely as the latest data suggests that declining consumer confidence is starting to impact purchasing habits.
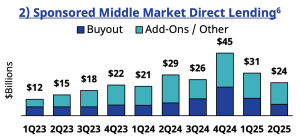
After a strong start to the year, volatility dampened middle market M&A activity beginning in April. Loans backing new sponsor buyouts fell 35% in the second quarter amid policy uncertainty (Graph 2).
In contrast, financing for add-on acquisitions held steady and other transaction types slowed only modestly. Add-on acquisitions have long comprised a large share of PennantPark’s deal flow regardless of market environment, and growing alongside our borrowers is a key component of our value proposition as a strategic lender. It’s no surprise that direct lenders continue to take share in the core middle market where certainty, speed, and relationship continuity remain critical. Mobilizing a syndicate of lenders in the same way simply isn’t possible, especially during periods of market volatility.
Supported by stable demand from existing platforms, total middle market deal flow during the first half of 2025 actually exceeded last year’s first-half pace. With resilient economic fundamentals, policy stability, and interest rate relief on the horizon, we see room for deal flow to accelerate into the second half, just as it did last year.
After several reductions in the second half of last year, the Federal Reserve has yet to cut rates in 2025. With the Secured Overnight Financing Rate (“SOFR”) hovering near 4.4%, our investors continue to benefit from a “Goldilocks” environment of elevated interest rates alongside steady economic growth.
All signs point to a resumption of monetary easing in the months ahead. While recent economic data has been constructive overall, Federal Reserve Chair Jerome Powell noted that risks to the U.S. job market were rising and signaled that a rate cut may be considered at the upcoming Federal Reserve meeting in September.
He stated, “The stability of the unemployment rate and other labor market measures allows us to proceed carefully… Nonetheless, with policy in restrictive territory, the baseline outlook and the shifting balance of risks may warrant adjusting our policy stance.”(7)
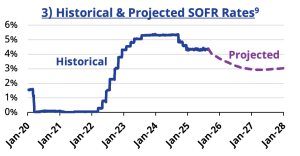
Market participants quickly recalibrated following Powell’s comments, with expectations for a September rate cut rising to almost 90%.(8) A second cut is anticipated in December. When the dust settles, we expect SOFR to settle into a long-term neutral range of 3.0% to 3.5% — still a historically attractive level compared to the near-zero rates that prevailed for much of the past fifteen years (Graph 3).
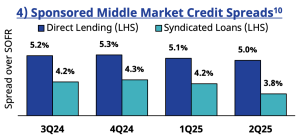
Credit spreads tightened over the past year amid renewed risk appetite from investors. In the middle market, direct loans now feature average credit spreads of SOFR + 5.0%, roughly twenty basis points tighter than a year ago (Graph 4).
We note that PennantPark has consistently earned wider spreads by focusing on smaller borrowers, pursuing less competitive opportunities, and leveraging our value as a strategic partner. For example, loans in our newest private fund carry a weighted average spread of SOFR + 5.5%.
The more striking trend is in the upper middle market, where investment banks and large direct lenders compete to deploy substantial sums of capital. This has driven more pronounced spread compression among syndicated loans relative to direct lenders. In the middle market, direct lenders now earn excess spread of 1.2% over syndicated deals. Since direct lenders also generally earn higher closing fees, our yield advantage is even greater at approximately 1.6% (Graph 5).

Lenders to large corporations — often defined as companies with revenues of $500 million or more — are willing to accept even lower yields. The middle market yield premium over loans to large corporates is now a full 2.0%. As we wrote last year, private credit is not a monolith and distinct trends are emerging across different segments of the market. As these dynamics evolve, PennantPark is well positioned to capture value where opportunities are most compelling.
Private credit fundraising continues to tilt toward mega funds — those targeting $5 billion or more — amplifying the divide between capital supply and borrower demand in the large company segment. This concentration fuels increasingly aggressive behavior from the largest direct lenders, who face pressure to deploy capital at scale in a competitive market. A record 47% of capital raised went to mega funds in 2024, a figure that accelerated to 61% in the first quarter of 2025 (Graph 6). This trend helps explain the spread compression at the top of the market.

It isn’t feasible for these mega funds to operate in the core middle market at scale. Our smaller investments require the same level of diligence, yet barely move the needle on their deployment needs. Many lenders have therefore outgrown the core middle market over the past decade — and, fortunately, we haven’t seen them return despite the attractive opportunity set.
The threat of new entrants in our market has also failed to materialize. First-time funds have accounted for only 1.6% of capital raised since the beginning of 2022.(13) And even for those able to raise capital, displacing existing lenders like PennantPark is a steep challenge. After all, our senior investment professionals have cultivated sponsor and borrower relationships for eighteen years (and much longer when including previous roles). So even as growing lenders depart the core middle market, few new players have filled the void. That bodes well for those of us that remain.
For the first time, direct loans to large companies carry higher leverage multiples than large syndicated deals. This inversion underscores how aggressively large direct lenders are competing for business, often at the expense of credit quality. In contrast, leverage in the core middle market remains far more restrained (Graph 7).

We mentioned earlier that our latest private fund earns spreads about 50 basis points above industry averages. Yet its median leverage multiple is just 3.8x — over half a turn lower than the middle market average and more than 2.0x below large corporate loans. This balance of potentially stronger returns with less structural risk is exactly why we remain committed to the lower end of the market.
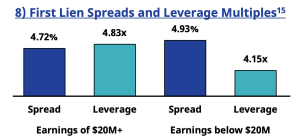
While we generally target cash-flowing borrowers with $10 million to $50 million of earnings, today’s most compelling opportunities lie at the lower end of that range. The competitive pressures that fuel middle market yield premiums versus large corporate loans are equally evident within the core middle market itself — favoring companies below $20 million of earnings. As shown below, loans to these companies have higher spreads and substantially lower leverage (Graph 8).
This dynamic aligns well with our ethos of building longterm partnerships, not one-off transactions. We aim to be a strategic capital provider, supporting borrowers through repeat and follow-on financings over time. And when portfolio companies eventually “graduate” to cheaper sources of capital, we view it as a mark of success.
Beyond lending, we also seek to participate directly in the success of our portfolio companies through selective equity co-investments. By investing directly alongside equity sponsors, we strengthen alignment and share in the value creation process as a strategic lender. This opportunity is rarely available when lending to larger companies, and simply not practicable in a broadly-syndicated deal.
With some lenders relaxing underwriting standards to win business, paid-in-kind (PIK) interest structures have become increasingly common. PIK loans allow borrowers to pay interest with additional debt rather than cash, a potential warning sign that highly-levered borrowers are struggling to service their debt. These structures also boost reported investment income and portfolio yields even though PIK interest is not received in cash.
At PennantPark, we prioritize stable and cash-flowing borrowers and maintain limited exposure to PIK loans. In fact, PennantPark Floating Rate Capital Ltd. (NYSE: PFLT) had virtually no exposure to PIK loans according to a recent Raymond James research report. In contrast, some lenders now generate more than 25% of their investment income from full or partial PIK loans (Graph 9).

Unfortunately, reported figures may understate the true prevalence of PIK loans. In a recent development aimed at obfuscating rising PIK exposure, certain lenders have engineered “synthetic PIK” investments by pairing a cash-pay term loan with a delayed-draw revolver. Instead of servicing the term loan with operating cash flow, the borrower draws on the revolver to cover interest payments — effectively paying with more debt. These structures are not disclosed in financial statements despite the risks they create.(17)
Collateralized loan obligations (“CLOs”) are an important financing tool for managers that utilize fund leverage to enhance investor returns. By dividing a highly diversified portfolio of loans into multiple tranches that appeal varying risk and return appetites, CLOs can broaden the lender universe and reduce financing costs.
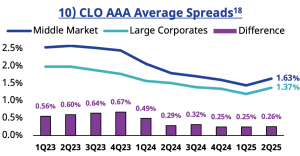
Until recently, the CLO industry was dominated by structures backed by broadly-syndicated loans (“BSL”) to large borrowers. But today, middle market CLOs account for an increasing share of the market. As adoption has increased, the average cost of debt for middle market CLOs has steadily declined. In addition, the gap between AAA debt spreads on middle market CLOs and BSL CLOs has compressed to only 0.26% (Graph 10).
That’s a tremendous benefit to our funds that rely on CLO structures as an alternative to traditional asset-based financing solutions.
As we’ve demonstrated, private credit remains an attractive asset class — but not a uniform one. Investors should continue to track where capital is flowing, how it’s being deployed, and which lenders maintain discipline in their underwriting standards. Selectivity, not scale, will ultimately dictate outperformance through market cycles, a lesson that overzealous managers may learn the hard way if the economic cycle turns.
For investors evaluating private credit or diversifying beyond the mega funds, we encourage you to reach out to our team to discuss these trends in more detail.
PennantPark is an independent middle market credit platform founded in 2007 by private credit industry veteran Art Penn (Co-Founder and former Managing Partner at Apollo Credit). As of 2025, PennantPark has invested over $26 billion in over 780 private credit transactions since its inception. Our clients include some of the world’s largest and most sophisticated institutional investors. We are in the process of expanding our offerings to focus on the private wealth market. The Firm is headquartered in Miami and has additional offices in New York, Chicago, Houston, Los Angeles, Amsterdam, and Zurich. PennantPark primarily invests in the core middle market, defined as companies with earnings of $10 million to $50 million. Our industries of focus include business services, government services, healthcare, consumer, and software/technology. PennantPark is an experienced manager of BDCs, LP drawdown vehicles, CLOs, SMAs, and joint ventures.

The material included in this publication is confidential and is intended for informational purposes only. This letter may not be reproduced and may not be redistributed to any party without prior written consent. It is neither advice nor a recommendation to enter into any transaction and is not an offer to buy or sell any security. Any offer or solicitation may only be made by delivery of the private placement memorandum of the respective fund.
The views, opinions, and assessments expressed in this letter reflect the current thinking of PennantPark Investment Advisers, LLC and are based on information available at the time of writing. These statements are intended solely to provide context regarding the firm’s current investment strategy and portfolio composition. They do not constitute predictions or guarantees of future performance and may not be applicable to other market segments, investment approaches, or time periods. Actual outcomes may differ materially due to a variety of economic, market, and company-specific factors.
This document may contain forward-looking statements, including opinions, projections, and expectations regarding future events or performance. These statements are inherently uncertain, are based on current assumptions, and involve risks and uncertainties that could cause actual outcomes to differ materially.
While certain parallels can be drawn from prior economic or market cycles, no historical period offers a precise predictor of future outcomes. Conditions impacting future performance may differ materially from those observed in the past.
Past performance is not indicative of, or a guarantee of, future results. Actual results may vary, and there is no assurance that historical performance—whether during prior market disruptions or economic cycles—will be replicated.
Statements of fact or analysis provided herein are based on internal assessments unless otherwise noted. While believed to be accurate and current, they may be based on incomplete data and are subject to change without notice.
The performance return and attribution estimated figures represented herein are preliminary and unaudited. Individual portfolio company performance should not be considered representative of all portfolio companies held by a fund, and there can be no assurance that future investments will produce similar results.
Specific investments described herein do not represent all investment decisions made by PennantPark. The reader should not assume that investment decisions identified and discussed were or will be profitable. Specific investment advice references provided herein are for illustrative purposes only and are not necessarily representative of investments that will be made in the future.
An investment in the interests of any PennantPark fund is suitable only for sophisticated investors and requires the financial ability and willingness to accept the risks and lack of liquidity that are characteristic of an investment in such funds. Investors must be prepared to bear such risks for an extended period of time. There can be no assurance that any investments will be profitable, not lose money, or achieve the other intended purposes for which they are made. In particular, the risks of investing in such funds may include: 1) Lack of liquidity in that withdrawals are generally not permitted, and there is no secondary market for Interests and none is expected to develop; 2) Restrictions on transferring Interests; 3) The use of leverage; and 4) Less regulation and higher fees than mutual funds. This is not intended to be a complete description of the risks of investing in such funds. Investors should rely on their own examination of the potential risks and rewards. Prospective investors should consult with their own legal, tax, and financial advisers as to the consequences of an investment.
The investment strategies and portfolio composition described herein may be modified in the future by PennantPark Investment Advisers, LLC (“PennantPark”) in its sole discretion at any time and without further notice to investors in response to changing market conditions, or in any manner it believes is consistent with the overall investment objective of the respective funds.
The opinions expressed herein represent the general observations of PennantPark management regarding macroeconomic and financial market performance during the applicable period. This document contains forward-looking statements based upon certain assumptions. All information has been obtained from sources believed to be reliable and current, but accuracy cannot be guaranteed.
The performance return and attribution estimated figures represented herein are preliminary and unaudited. Past performance is no indication of future performance. Individual portfolio company performance should not be considered representative of all portfolio companies held by a fund, and there can be no assurance that future investments will produce similar results.
Specific investments described herein do not represent all investment decisions made by Pennant Park. The reader should not assume that investment decisions identified and discussed were or will be profitable. Specific investment advice references provided herein are for illustrative purposes only and are not necessarily representative of investments that will be made in the future.
An investment in the interests of any PennantPark fund is suitable only for sophisticated investors and requires the financial ability and willingness to accept the risks and lack of liquidity that are characteristic of an investment in such funds. Investors must be prepared to bear such risks for an extended period of time. There can be no assurance that any investments will be profitable, not lose money, or achieve the other intended purposes for which they are made. In particular, the risks of investing in such funds may include: 1) Lack of liquidity in that withdrawals are generally not permitted, and there is no secondary market for Interests and none is expected to develop; 2) Restrictions on transferring Interests; 3) The use of leverage; and 4) Less regulation and higher fees than mutual funds. This is not intended to be a complete description of the risks of investing in such funds. Investors should rely on their own examination of the potential risks and rewards. Prospective investors should consult with their own legal, tax, and financial advisers as to the consequences of an investment.
The investment strategies and portfolio composition described herein may be modified in the future by PennantPark Investment Advisers, LLC (“PennantPark”) in its sole discretion at any time and without further notice to investors in response to changing market conditions, or in any manner it believes is consistent with the overall investment objective of the respective funds.
Endnotes:
Source: Bloomberg. Data through August 29.
Source: Bureau of Economic Analysis, Gross Domestic Product, 2nd Quarter 2025 (Second Estimate). Published August 28, 2025.
Source: Bureau of Labor Statistics, The Employment Situation — July 2025. Published August 1, 2025.
Source: Factset, Earnings Insight – Q2 2025. Published August 29, 2025. 98% of S&P 500 companies had reported actual results at time of publication. Earnings estimates were used for the remaining 2% of companies that had not yet reported financial results.
Earnings increase represents the weighted average EBITDA increase across all PennantPark directly-originated investments. Data based on the most recently available financial reporting for each portfolio company as of July 29, 2025.
Source: LSEG LPC, Middle Market Connect: The Middle Market Opportunity. Published July 2025.
Source: Board of Governors of the Federal Reserve System, Monetary Policy and the Fed’s Framework Review. Published August 22, 2025.
Source: Morningstar, Why Powell’s Jackson Hole Speech Suggests an Interest Rate Cut Is on the Way. Published August 22, 2025.
Source: Bloomberg. Data accessed August 29, 2025. The SOFR forward curve is the market’s projection of SOFR based on SOFR futures contracts
Source: LSEG LPC, Middle Market Connect: The Middle Market Opportunity. Published July 2025.
Source: LSEG LPC, Middle Market Connect: The Middle Market Opportunity. Published July 2025.
Source: PitchBook, Q1 2025 Global Private Market Fundraising Report. Published May 23, 2025.
Source: PitchBook, Q1 2025 Global Private Market Fundraising Report. Published May 23, 2025.
Source: LSEG LPC, Middle Market Connect: The Middle Market Opportunity. Published July 2025.
Source: LSEG LPC, Middle Market Connect: The Middle Market Opportunity. Published July 2025.
Source: Raymond James, 2Q25 PIK Trends: Share of Total and Net Investment Income — Slight Decline Due to Defaults. Published August 28, 2025. Data shows the share of first lien loans with full or partial paid-in-kind coupons across selected funds in Raymond James’s BDC coverage universe. Share of PIK exposure for additional BDCs in Raymond James’s coverage universe is available upon request.
Source: Oppenheimer Equity Research, Payment-in-Kind (PIK) Analysis. Published August 26, 2025.
Source: LSEG LPC, Middle Market Connect: The Middle Market Opportunity. Published July 2025.
Assets under management (“AUM”) is defined as the sum of gross asset values, unfunded commitments, joint ventures, and available leverage for active funds as of 3/31/2025. Figures are rounded to the nearest billion.